Welcome to Stat 220
Day 01
About me
- First year at Carleton!
- PhD in Political Science from the University of Minnesota
- M.S. in Statistics from UMN
- Originally from(ish) Cleveland, Ohio
- Went to Wellesley College for undergrad
- Have an almost 2 year old toddler named Glenn
- Like to walk around lakes, bike, and try out local restaurants

What is this class all about?

You took a survey

Google saved your responses in a sheet

I read your data into R, cleaned it, and saved it as a CSV

Visualize
Code
survey |>
  count(class_year) |>
  mutate(prop = n/sum(n)) |>
  ggplot(aes(y = class_year, x = prop, fill = class_year)) +
  geom_col(show.legend = FALSE) +
  scale_x_continuous(labels = percent_format(accuracy = 1), breaks = c(0, .1, .2, .3, .4, .5)) +
  labs(
    title = "Class year among Stat220 Students",
    y = "",
    x = "Proportion",
    caption = "Self-reported data collected from Stat220 students by 8pm on March 29"
  ) +
  scale_fill_viridis_d(end = .75, option = "plasma")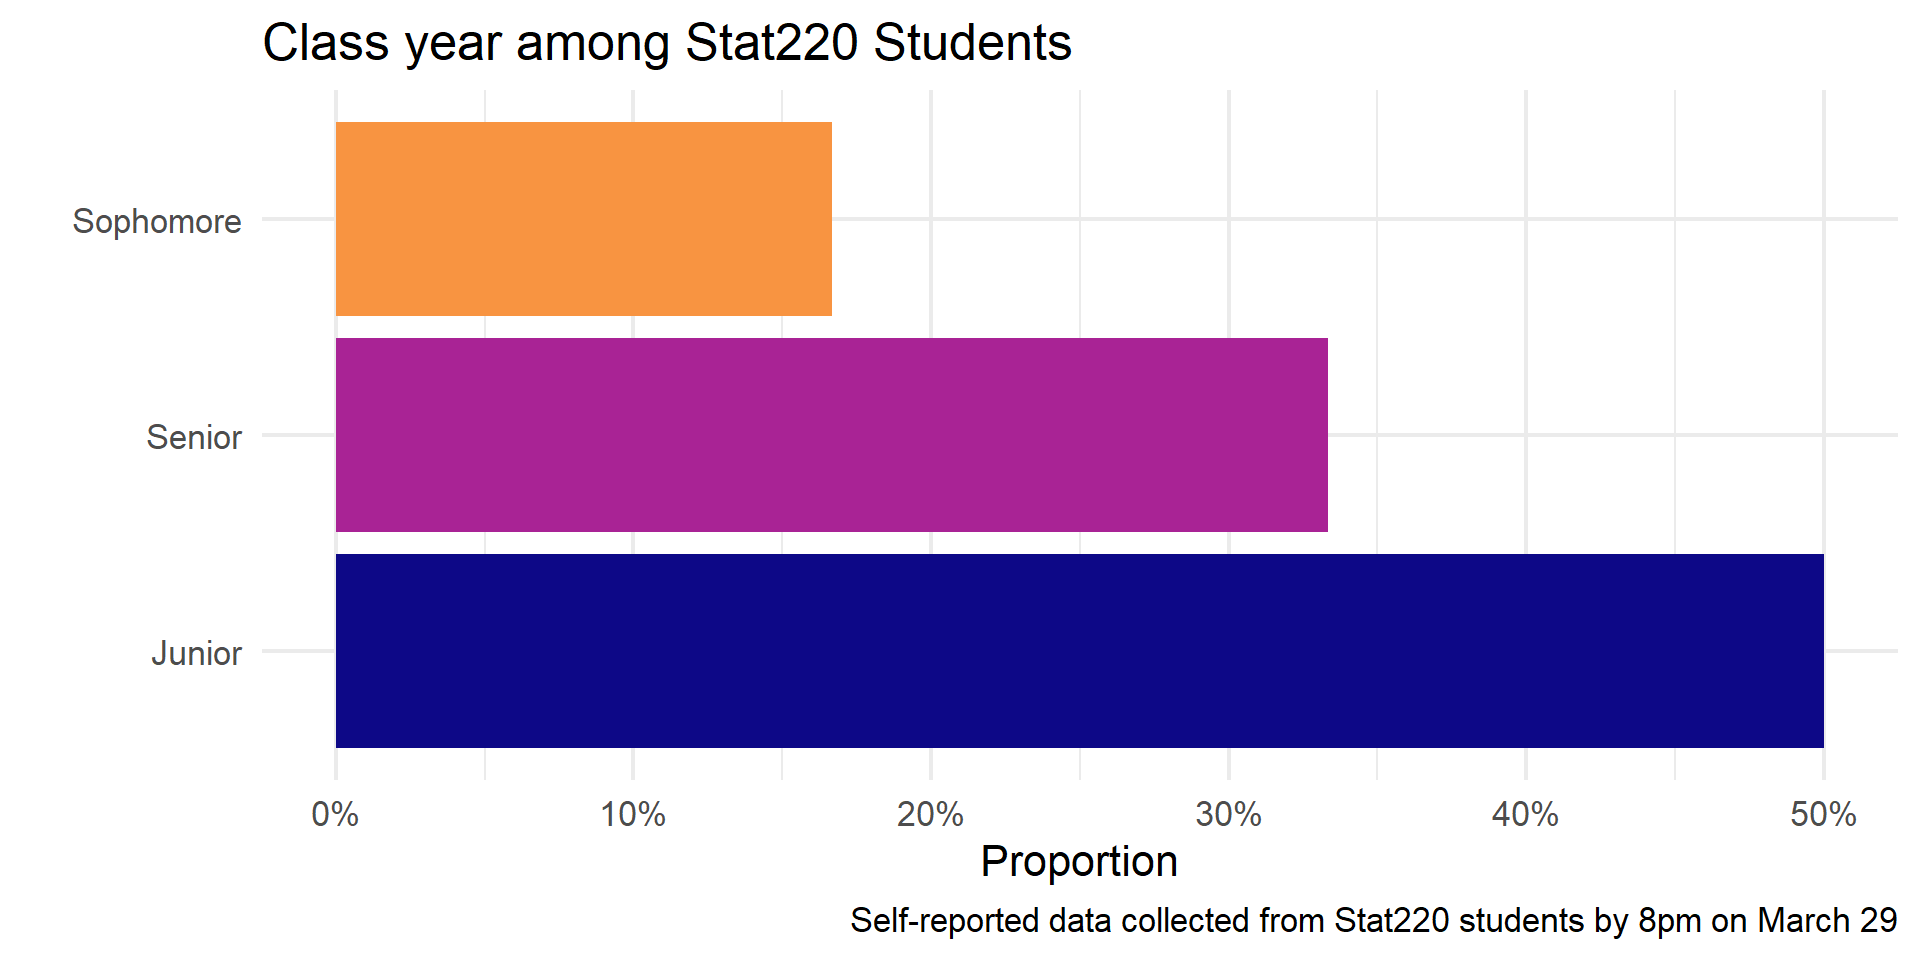
Visualize
Code
survey |>
  count(northfield_food) |>
  mutate(prop = n/sum(n)) |>
  ggplot(aes(y = northfield_food, x = prop, fill = northfield_food)) +
  geom_col(show.legend = FALSE) +
  scale_x_continuous(labels = percent_format(accuracy = 1), breaks = c(0, .1, .2, .3, .4, .5)) +
  labs(
    title = "Where can you find the best food in Northfield?",
    y = "",
    x = "Proportion",
    caption = "Self-reported data collected from Stat220 students by 10am on Jan 5"
  ) +
  scale_fill_viridis_d(end = .75, option = "plasma")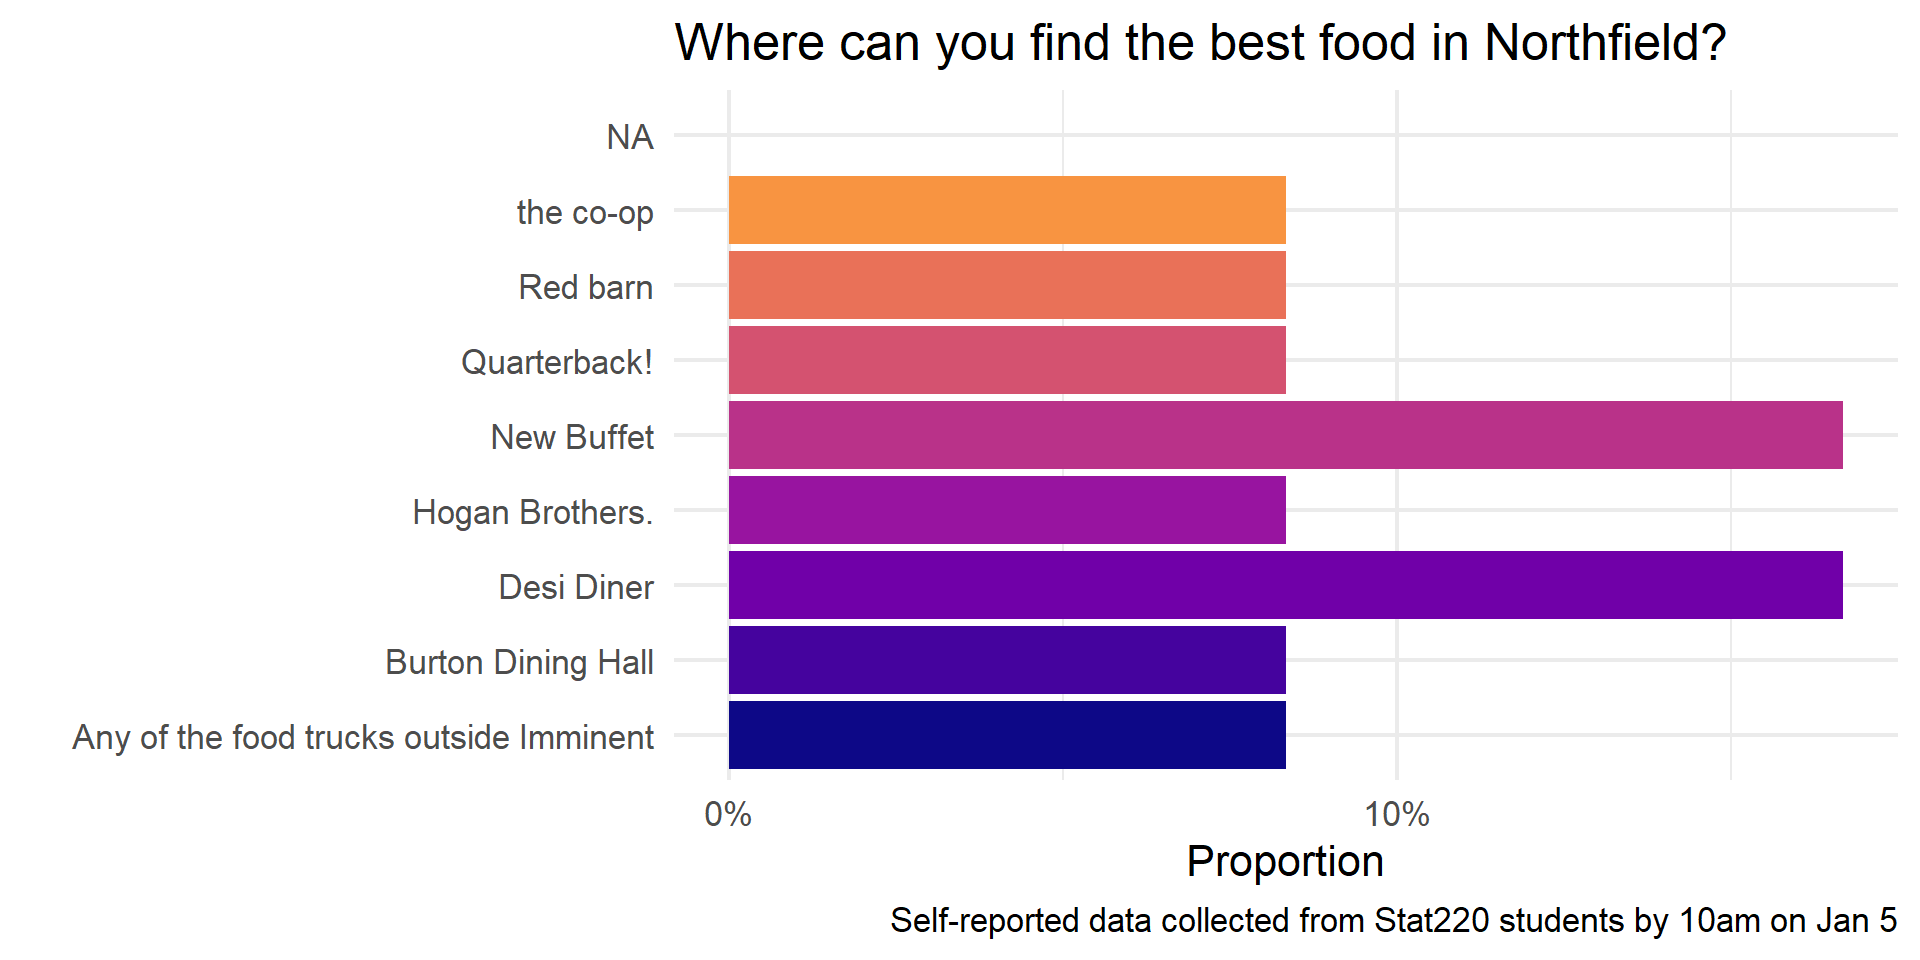
What do you do for fun?
Code
library(wordcloud)
library(tm)
library(NatParksPalettes)

word.corpus<-VCorpus(VectorSource(survey$fun)) #Corpus
word.corpus<-word.corpus%>%
  tm_map(removePunctuation)%>% ##eliminate punctuation
  tm_map(removeNumbers)%>% #no numbers
  tm_map(stripWhitespace)#white spaces
word.corpus <- tm_map(word.corpus, removeWords, c("the", "and","for","this","that","with","will","also","i'm"))
word.corpus<-tm_map(word.corpus, stemDocument)
word.counts<-as.matrix(TermDocumentMatrix(word.corpus))
word.freq<-sort(rowSums(word.counts), decreasing=TRUE)
#head(word.freq)##what are the top words?
wordcloud(words=names(word.freq), freq=word.freq, scale=c(3,.5),max.words = 100, random.order = TRUE,
          min.freq = 1, color=natparks.pals("Torres"))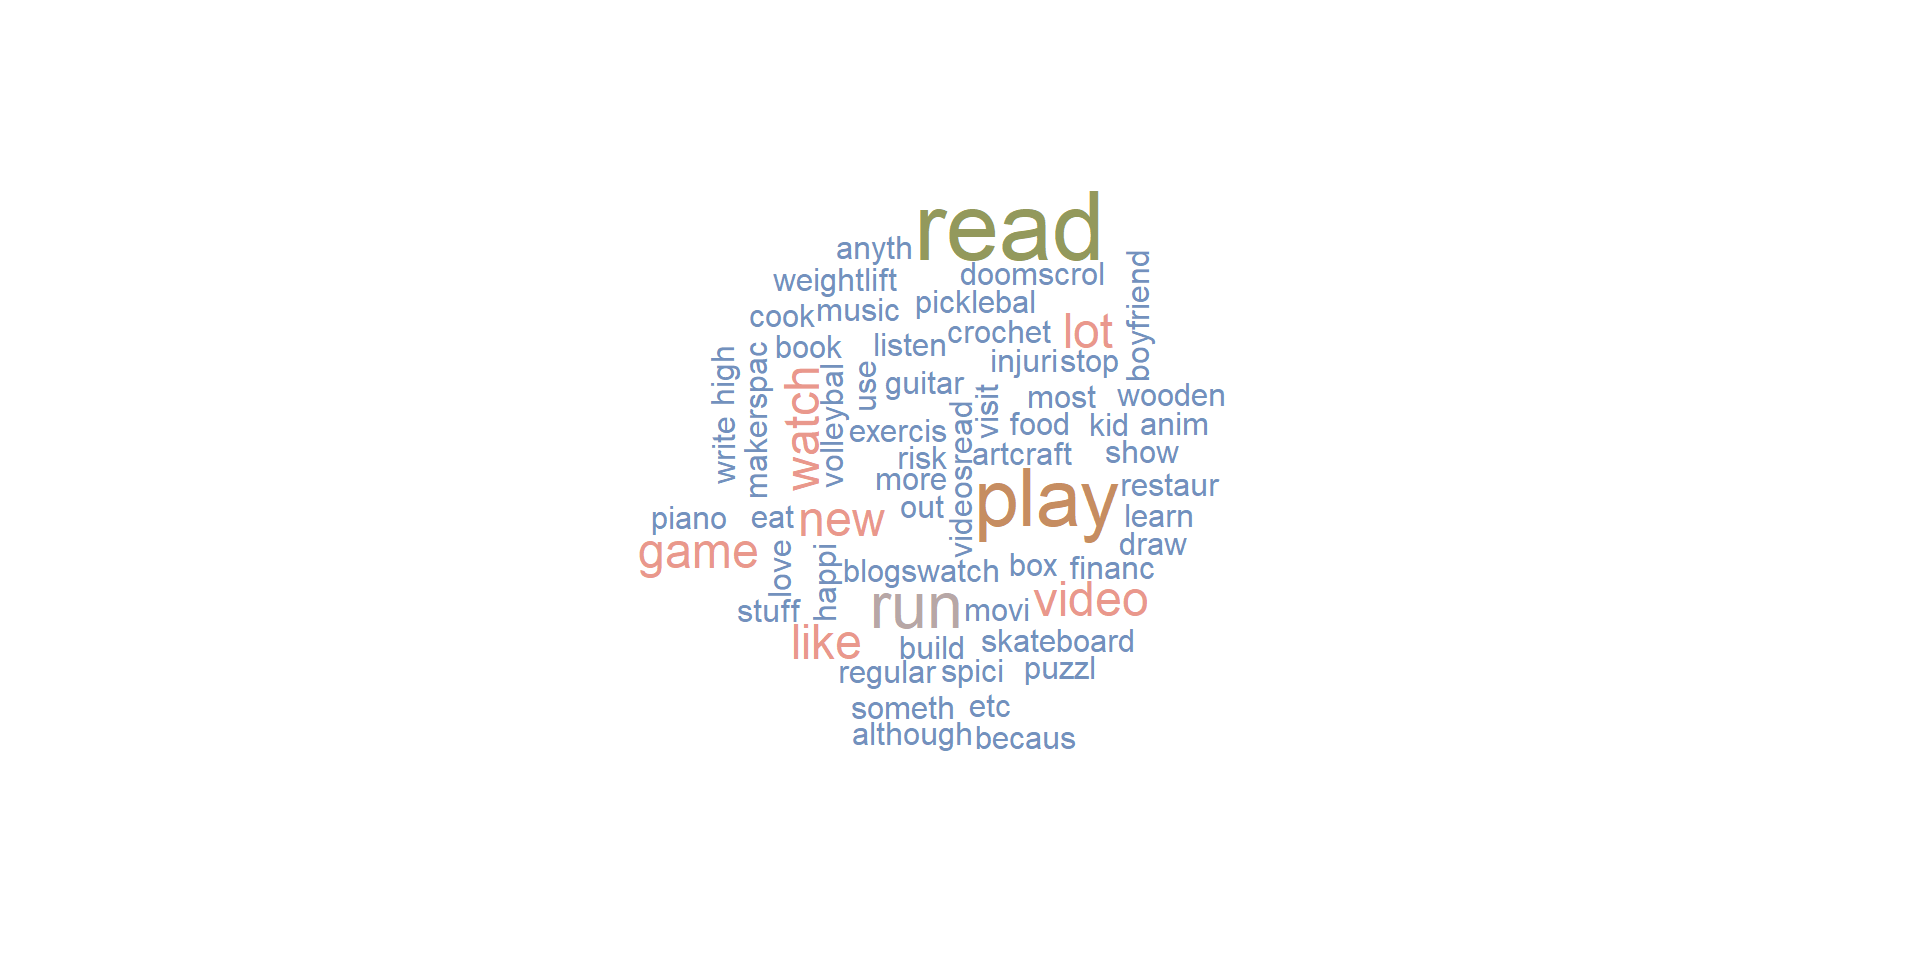
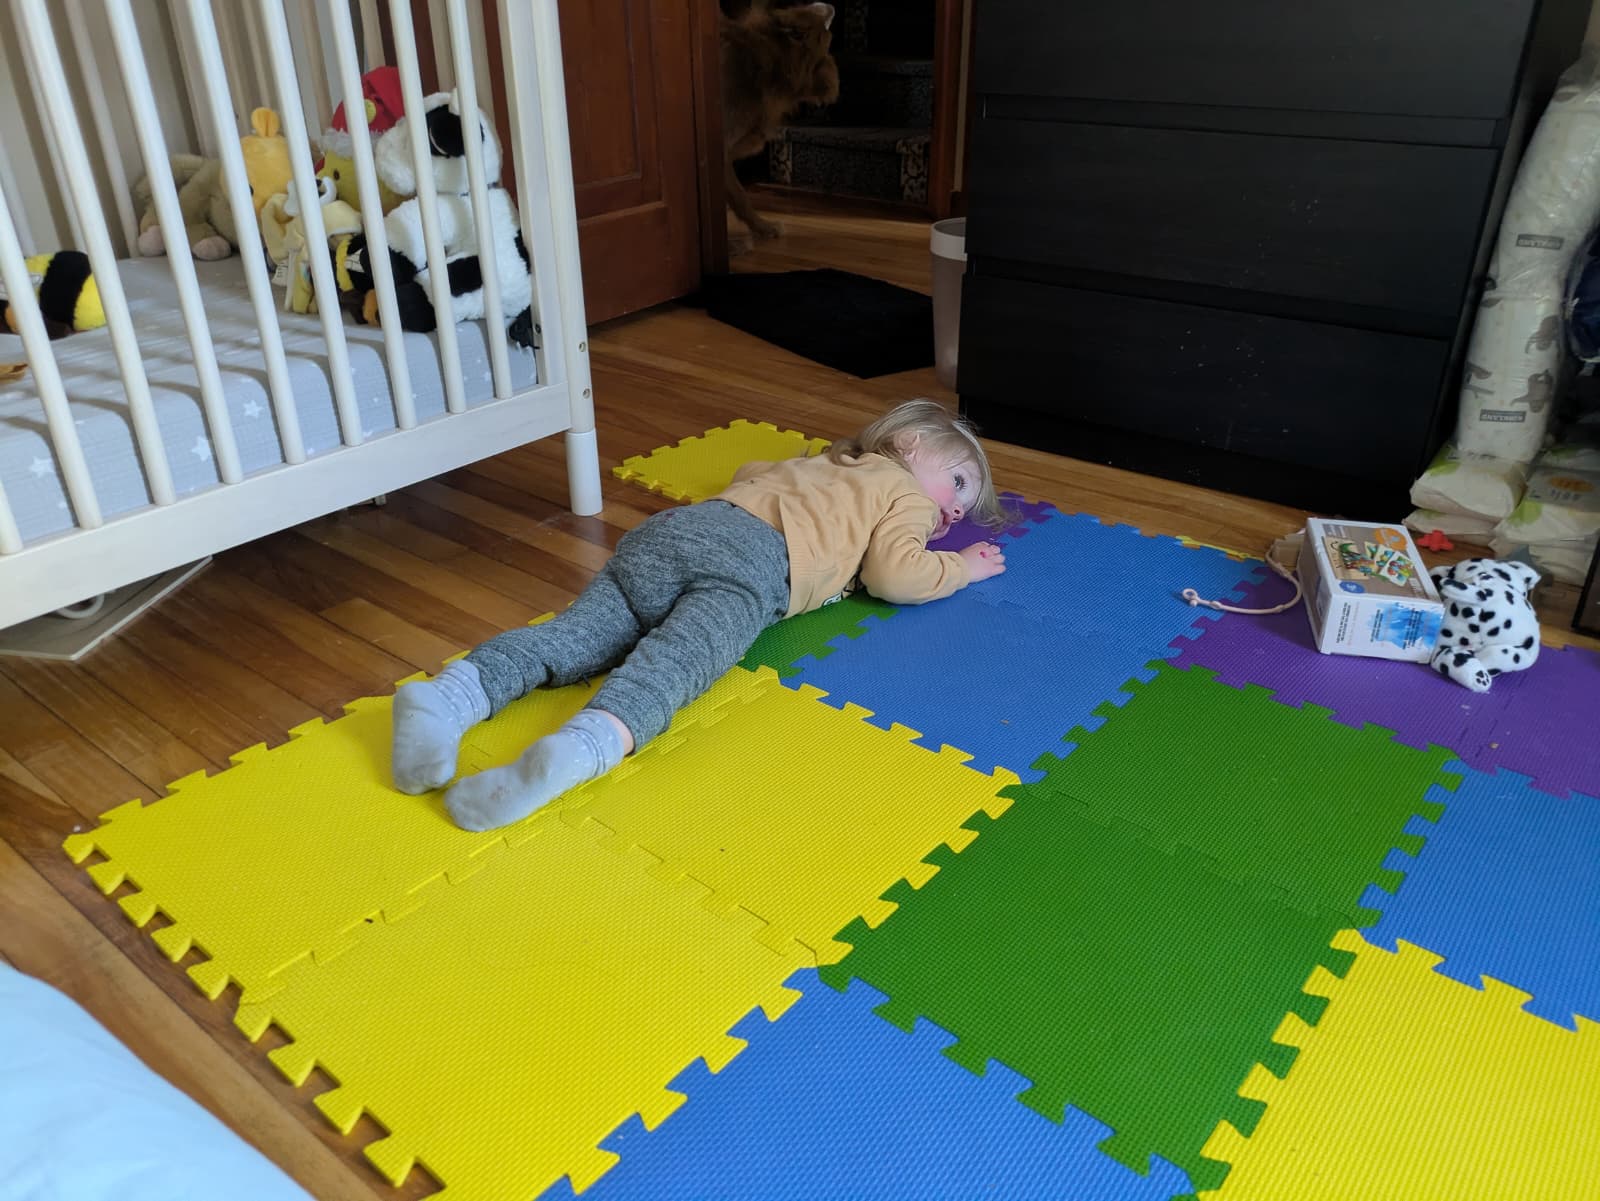
It’s easy when you start out programming to get really frustrated and think, “Oh it’s me, I’m really stupid,” or, “I’m not made out to program.” But, that is absolutely not the case. Everyone gets frustrated. I still get frustrated occasionally when writing R code. It’s just a natural part of programming. So, it happens to everyone and gets less and less over time. Don’t blame yourself. Just take a break, do something fun, and then come back and try again later.